Datasets
Course Datasets
We use two Texas datasets across the course — a public-administration spine (city sales tax, for PA 3311) and a political-science spine (county voter turnout & elections, for PS 3315). Every technique builds on data you already know. Download the files and work the exercises in Excel (enable the Data Analysis ToolPak).
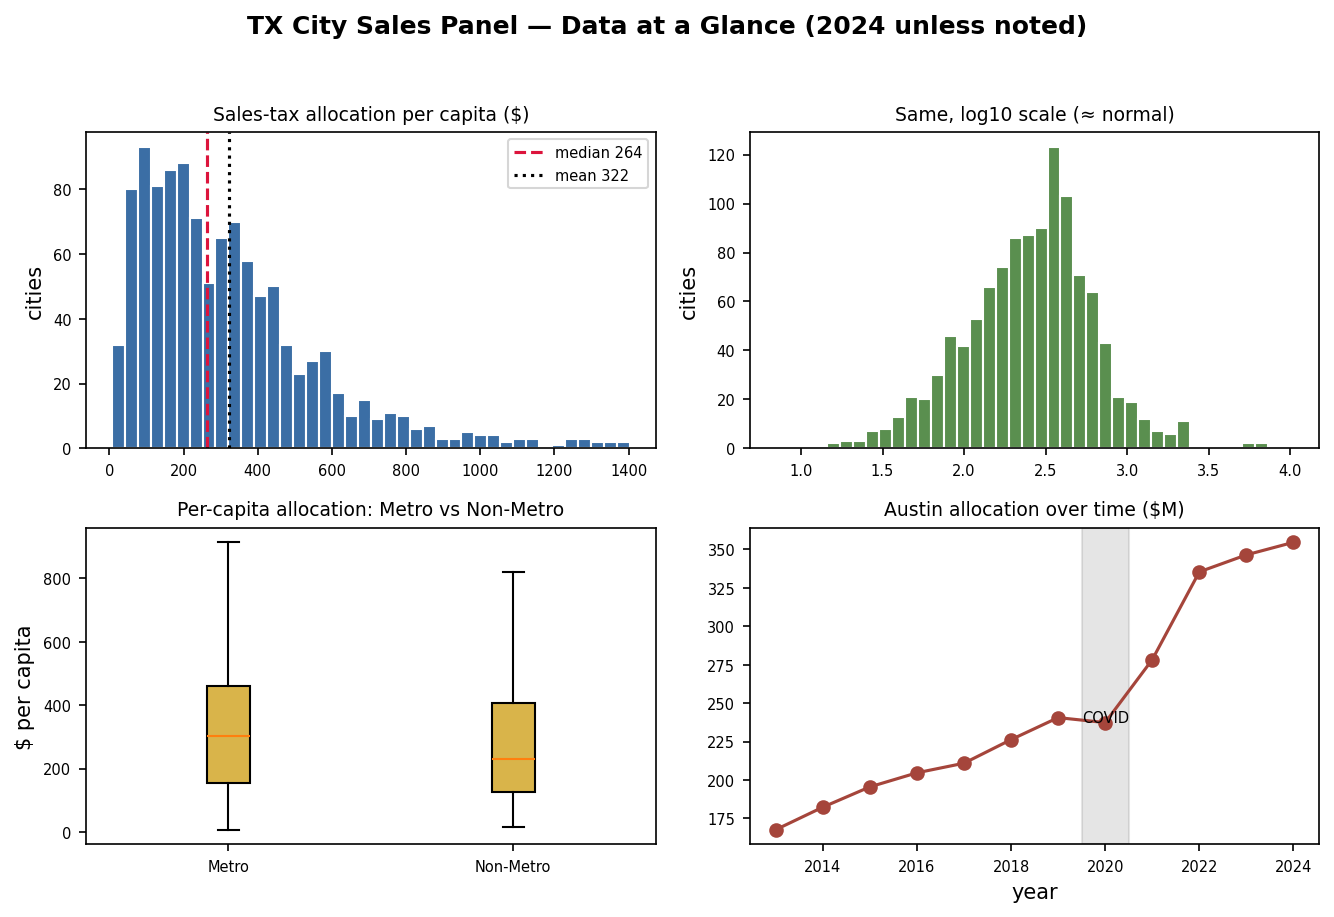
Primary spine — Texas City Sales Panel (2013–2024)
One row per Texas city per year — 1,180 cities, 13,930 city-years. Sales-tax allocation, taxable sales, business outlets, local sales-tax rate, plus county, metro status, and a 2022 reference population.
- 📊 Download (Excel) — includes Codebook and Summary tabs
- 📄 Download (CSV)
Supplement — Texas City Finance Cross-Section (2022, with debt)
One row per city (1,202 cities) for a single year, adding debt and property/total taxes from the Census of Governments. Use it for the regression module if you want a debt outcome.
Second spine — Texas County Political Panel (2000–2024)
For the political-science side (PS 3315): one row per county per presidential election — 254 counties × 7 elections (2000–2024) = 1,778 rows. Vote totals and Republican/Democratic two-party share, turnout (votes ÷ voting-age population, 2012–2024), plus demographic (population, race/ethnicity, median age, density, metro status) and socioeconomic (median household income, poverty, unemployment, % bachelor’s+) characteristics — so you can run the same methods on political outcomes.
- 📄 Download (CSV)
- 📘 Codebook — variables, sources (MIT Election Lab, Census PEP/SAIPE, USDA ERS), and limitations
Sample questions: do metro vs. rural counties differ in turnout (independent t-test)? Did a county’s partisan share shift 2016 vs. 2020 (paired t-test)? Does income or education predict turnout (regression)?
Documentation
- 📘 Codebook — every variable defined, with sources, caveats, summary statistics, and a module-by-module usage map
- 🖼️ Data at a Glance (one-page PDF)
- 🔗 Data sources & licensing
How each module uses this one file
| Module | What you do |
|---|---|
| Describing data | distribution of sales-tax per capita — histograms, mean vs. median, outliers |
| Probability & the normal curve | standardize per-capita sales tax; areas under the curve |
| Statistical inference | confidence interval for the mean |
| Independent t-test | Metro vs. Non-Metro cities |
| Paired t-test | 2019 vs. 2023 (pre/post-COVID), same cities |
| Regression | allocation vs. taxable sales; add a second predictor (OVB) |
| Final project | your own question, same data |
Tip: to get a single year in Excel, use Data → Filter on the
yearcolumn, or a PivotTable.
Sources
All free, no API key: Texas Comptroller open data (data.texas.gov), the U.S. Census 2022 Census of Governments, and the OMB/Census CBSA metro delineation. The full build code is in scripts/.
Chapter example datasets
Smaller datasets used in specific chapter walkthroughs:
- Texas Voter Turnout (2020) — 252 counties
- Austin-Travis County EMS (2018–2026) — 99 months
- Texas Daily Weather (2023) — 1,095 daily observations