Chapter 2: Program Theory and Logic Models
Epigraphs
“There is nothing so practical as a good theory.” — Kurt Lewin, Field Theory in Social Science (1951)
“Programs are theories. Evaluation is the test of those theories.” — paraphrasing Carol H. Weiss, Evaluation (1998), on theory-based evaluation
Opening Case: The Theory Behind Moving to Opportunity
In the 1990s, the U.S. Department of Housing and Urban Development launched Moving to Opportunity (MTO) — our Case D. The program had a deceptively simple design. Families living in high-poverty public housing in five cities entered a lottery; winners were offered a housing voucher (some restricted to low-poverty neighborhoods, with counseling) that they could use to move. The ultimate goal was ambitious: that moving children out of concentrated poverty would improve their schooling, health, and adult economic prospects.
The implicit reasoning was a long causal chain. A voucher lets a family move; moving puts the family in a lower-poverty neighborhood; the neighborhood offers safer streets, better schools, and different peers; over years, those exposures change a child’s trajectory; and decades later that child earns more and attends college at higher rates. Each “lets,” “puts,” and “changes” is a causal claim — and a place the chain can break.
And one link did partly break in a way that program theory predicts: winning the lottery is not the same as moving. Take-up of the voucher was only partial — many families who were offered the voucher did not use it, or did not stay in a low-poverty neighborhood. Yet the long-run findings were striking where the chain held: Chetty, Hendren, and Katz (2016) showed that children who moved young (before age 13) later earned about $3,477 (31%) more per year in their mid-twenties than the control mean of $11,270, with higher college attendance. Earlier work by Kling, Liebman, and Katz (2007) had found large gains in adult mental health but limited short-run economic effects — a reminder that different boxes in the chain move on different timescales.
This is a program theory problem before it is a data problem. To know which finding to expect, and why the gap between offering a voucher and a child’s adult earnings is so long, we must make the causal chain explicit — build a logic model — and then read the program’s evaluation questions and indicators directly off of it.
Guiding Questions
- What is the implicit chain of cause and effect connecting a housing voucher to a child’s adult earnings?
- Which links in that chain are plausible, and which are heroic assumptions?
- Where in the chain does the gap between offering the voucher and using it sit, and why does it matter?
Why This Chapter Matters
Every program rests on a theory — a set of beliefs about why the planned activities should produce the desired results. Usually that theory is implicit, scattered across grant applications and staff intuition. Making it explicit is the single most valuable thing an evaluator can do early, because the theory determines what questions to ask, what to measure, and how to interpret results. A logic model is the standard tool for surfacing program theory. It is not paperwork; it is the blueprint that tells you where to point your instruments.
Briefing: A logic model makes a program’s implicit theory explicit, and that explicit theory dictates the evaluation’s questions, indicators, and design.
Program Theory and the Theory of Change
Program theory is the model of how and why a program is supposed to work. It has two interlocking parts. The theory of change (sometimes called the impact theory) is the causal story: the sequence of changes by which the program’s activities are expected to produce its ultimate outcomes. The theory of action (or process theory) is the operational story: how the program will be organized and delivered to set that causal sequence in motion.
For MTO, the theory of change runs: a voucher enables a move; the move places the family in a lower-poverty neighborhood; that neighborhood exposes children to safer environments, better schools, and different peers; sustained exposure improves educational attainment and health; and those gains translate, years later, into higher adult earnings. The theory of action is the operational machinery that sets this in motion: the lottery that allocates scarce vouchers, the counseling that helps families find and lease units in low-poverty areas, and the landlords willing to accept the voucher. When take-up is partial, it is usually the theory of action that has faltered — the causal story might be sound, but the delivery did not place enough families where the story requires them to be. Every “enables,” “places,” and “improves” in the theory of change is a causal claim — and a place the chain could break.
Briefing: State the theory of change as a sequence of explicit “if–then” links; each link is a testable claim, and the weakest link caps the whole program’s plausibility.
The Logic-Model Chain
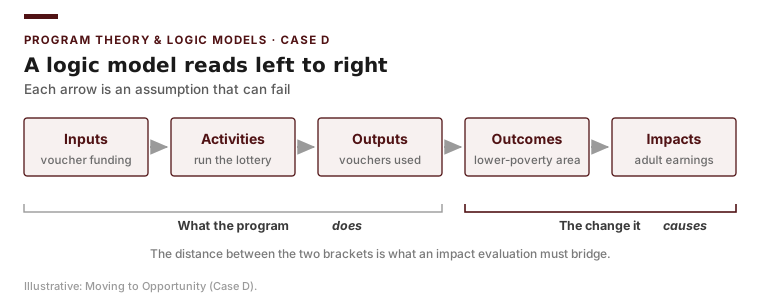
A logic model lays the program theory out as a left-to-right chain of five linked elements. Using MTO:
- Inputs — the resources invested: HUD voucher funding, the eligible pool of public-housing families, mobility counseling staff, participating landlords.
- Activities — what the program does with those inputs: run the lottery, issue vouchers, counsel families on low-poverty neighborhoods, lease units.
- Outputs — the direct, countable products of the activities: vouchers offered, families that actually moved (take-up), share who landed in low-poverty tracts.
- Outcomes — the changes in participants the program seeks, layered by time horizon. Short-term outcomes (neighborhood poverty exposure, safety, parental mental health) occur within a few years; intermediate outcomes (children’s school quality, attendance) over the following years.
- Impacts — the long-term, often population-level changes the program ultimately aims at: adult earnings (the $3,477/31% gain for those who moved young), college attendance, intergenerational mobility.
The convention is that inputs and activities are within the program’s control; outputs are largely within its control; outcomes and impacts are progressively less controllable because they depend on the world cooperating with the program’s theory. The further right you move, the stronger the assumptions and the longer the causal distance between what the program does and what it hopes to achieve.
Briefing: Inputs → activities → outputs → outcomes → impacts. Control decreases and assumption-burden increases as you move rightward.
Assumptions and External Factors
Two elements are easy to omit and dangerous to ignore. Assumptions are the beliefs that must hold for one box to lead to the next — for MTO, that families offered a voucher will actually use it (take-up), that low-poverty neighborhoods genuinely offer better schools and safety, and that childhood exposure matters more than the age at which a child moves. External factors are forces outside the program that affect outcomes regardless of program activity: the housing market, local labor demand, school-district policies. A good logic model names these in the margins, because they are exactly what an impact evaluation must rule out as alternative explanations.
From Logic Model to Evaluation Questions and Indicators
The payoff of a logic model is that evaluation questions fall out of it almost mechanically. Each link in the chain suggests a question, and each box suggests an indicator — an observable, measurable signal of that box.
- The inputs-to-activities link asks process questions: were the resources delivered and the activities carried out as planned? Indicators: vouchers funded, counseling sessions delivered, landlords recruited.
- The activities-to-outputs link asks reach and dosage questions: did the program serve the intended people at the intended intensity? Indicators: voucher take-up rate, share of movers reaching low-poverty tracts — the very gap that makes MTO’s partial take-up visible.
- The outputs-to-outcomes links ask outcome questions: did short-term changes occur? Indicators: census-tract poverty rate of the new neighborhood, parental mental-health scales (Kling, Liebman, and Katz 2007), children’s school quality.
- The outcomes-to-impacts links ask impact questions: did the ultimate goals move, and because of the program? Indicators: adult earnings, college enrollment — measured against the lottery’s control group, which is what makes the $3,477 gain credible.
Notice how this exposes a recurring failure mode: a program that measured the left side of the chain (vouchers issued = inputs, activities, outputs) but never instrumented the right side would have no way to detect the $3,477 earnings gain that took two decades to appear. The logic model flags that data gap before the program collects a single record. (Contrast Case A: a city economic-development sales tax has tidy input and output data — dollars allocated, the 2024 mean of $395 per capita — but the impact boxes, jobs and net revenue caused, are exactly the under-instrumented ones.)
Briefing: Read evaluation questions off the links and indicators off the boxes; a box with no planned indicator is a promise you cannot keep.
Common Logic-Model Errors
Building the model surfaces predictable mistakes. A missing link leaps from an early box to a distant impact with no intermediate mechanism — a voucher that supposedly causes higher adult earnings with no neighborhood-exposure box in between. An implausible link connects boxes that cannot reasonably be connected at the stated dosage. Outputs masquerading as outcomes list “X vouchers issued” in the outcomes column, confusing what the program did with the change it caused. An over-stuffed model claims every good thing in the world as an outcome, diluting focus and inviting failure on impossible promises. And an unstated-assumption error leaves the load-bearing beliefs invisible — MTO’s assumption that families would use the voucher is exactly the kind that, unexamined, lets a program look like a failure when only its delivery faltered.
Worked Example: Building and Critiquing the Logic Model in Excel
We can build a readable logic model directly in Excel — no special software needed. Open a blank workbook and:
- In row 1, type the five column headers across A1:E1: Inputs, Activities, Outputs, Short/Intermediate Outcomes, Impacts.
- Widen the columns (Home → Format → Column Width) and turn on text wrapping for the data range via Home → Alignment → Wrap Text so long phrases stay readable.
- Enter the program elements down each column (one item per cell).
- Select A1:E1 and apply bold and a fill color; then select the whole block A1:E8 and add Home → Borders → All Borders so it reads as a grid.
- Use a separate sheet tab named Assumptions & External Factors to list, for each left-to-right arrow, the belief that must hold and the outside force that could interfere.
- Optionally, draw arrows between columns with Insert → Shapes → Arrow to emphasize the causal flow.
The resulting model for MTO (Case D), in compact form:
| Inputs | Activities | Outputs | Short/Intermediate Outcomes | Impacts |
|---|---|---|---|---|
| HUD voucher funding | Run the lottery; issue vouchers | Vouchers offered | Lower neighborhood poverty exposure | Higher adult earnings ($3,477 / 31% for young movers) |
| Eligible public-housing families | Counsel families on low-poverty areas | Voucher take-up (partial) | Improved parental mental health | Higher college attendance |
| Mobility counselors; landlords | Lease units in low-poverty tracts | Share reaching low-poverty tracts | Better child school quality | Intergenerational mobility |
Now critique it. The jump from a voucher (an output) to a child’s adult earnings two decades later (an impact) crosses two whole columns of slow-moving outcomes — a long chain whose front end (take-up, neighborhood poverty) and back end (earnings) move on completely different timescales, which is exactly why Kling, Liebman, and Katz (2007) saw mental-health gains but limited short-run economic effects while Chetty, Hendren, and Katz (2016) saw the earnings payoff only once the children grew up. “Voucher take-up” correctly sits in outputs, not outcomes — being offered or even using a voucher is something the program did, not the life-trajectory change it ultimately seeks.
The same five-column discipline applies to the other four running cases:
| Case | Inputs → Activities | Outputs | Outcomes | Impacts |
|---|---|---|---|---|
| A — EDC sales tax | Dedicated sales-tax revenue → fund incentives, recruit firms | Incentive dollars allocated (2024 mean $395/capita) | New/retained business activity | Jobs created, net city revenue |
| B — Vote centers | County election budget → open any-location vote centers | Vote centers operating; ballots cast anywhere | Lower cost/convenience of voting | Higher turnout (2020 metro 0.554 vs. non-metro 0.580) |
| C — NSW | Wage-subsidy funds → place workers in subsidized jobs | Months of subsidized work delivered | Skills, work habits, experience | Higher unsubsidized earnings (+$1,794) |
| E — Perry Preschool | Foundation/grant funds → daily preschool + weekly home visits | Preschool sessions delivered; 58 children enrolled | School readiness; IQ ≥ 90 at age 5 (67% vs. 28%) | High-school graduation (65% vs. 45%); higher earnings; less crime |
Returning to the Case: Once MTO is laid out as a grid, HUD’s question answers itself: the program can defend its outputs (vouchers issued, take-up rate) and its short-term outcomes (neighborhood poverty, parental mental health), but its headline claim — higher adult earnings — sits at the far right of a long chain that only a randomized control group and twenty years of follow-up could credibly establish. The lottery design is precisely what let MTO instrument that far-right box. A program that promised the same impact without the lottery, or without measuring children into adulthood, would be claiming an effect it could never see.
Is the Program Ready to Be Evaluated? Evaluability Assessment
Not every program is ready for a full evaluation, and commissioning one anyway is a common, expensive mistake. An evaluability assessment is a short, front-end study — usually a few weeks — that asks whether an impact or outcome evaluation is worth doing yet. It sits between the evaluation charter of Chapter 1 (what does the user need to know?) and the design choices of Chapter 3 (how will we find out?), and it uses the logic model as its main diagnostic tool. Wholey, who introduced the technique in the 1970s, framed it as protecting everyone’s money: an evaluation that cannot succeed should be caught before the field budget is spent, not after.
An evaluability assessment poses four practical questions:
- Is the program’s theory coherent? Does a defensible logic model connect activities to the claimed outcomes, or does the chain leap from a voucher to adult earnings with no neighborhood-exposure box in between? A program built on a broken theory cannot be rescued by a clever design.
- Is the program actually implemented as designed? A vote-center rollout (Case B) that exists on paper but opened few locations, or an EDC sales tax (Case A) whose funds were never disbursed, has no “treatment” to evaluate. Evaluating a program that never really ran produces a null result that means nothing.
- Are the intended outcomes defined and measurable? Every box on the right side of the model needs an indicator and a plausible data source. MTO’s far-right earnings box was measurable only because administrative earnings records could be linked two decades out; a program promising “stronger communities” with no indicator is not yet evaluable.
- Will the intended users actually use the results? If the decision has effectively been made, or no one is positioned to act on the findings, even a flawless evaluation is wasted. This is the charter’s “primary intended user” question, asked again with money on the table.
When an assessment answers “no,” the deliverable is not an evaluation but a set of fixes: sharpen the logic model, wait until implementation stabilizes, add the missing indicators, or re-engage the decision-maker. Only when the four answers are “yes” is the program ready for the designs of Chapters 3 and 8.
Briefing: Before you evaluate, check that the program can be evaluated — coherent theory, real implementation, measurable outcomes, and a user who will act. An evaluability assessment catches the un-winnable study before its budget is spent.
Common Pitfalls
- Confusing the logic model with the program’s org chart or budget. It is a causal map, not an administrative diagram.
- Listing activities in the outcomes column. Verbs that the program performs are activities; “issued a voucher” is an activity, “moved to a lower-poverty neighborhood” is an outcome.
- Leaving assumptions unstated. MTO’s partial take-up shows what happens when the load-bearing assumption — families will use the voucher — goes unexamined.
- Promising impacts you will never measure. If a box has no indicator and no plan to collect it, do not claim it.
- Drawing one arrow from far-left to far-right. Long jumps hide the mechanism; insist on the intermediate boxes — voucher to earnings without a neighborhood box explains nothing.
Practice and Application
- Build a logic model (Excel). Choose one of the five running cases — NSW (C), MTO (D), the Texas EDC sales tax (A), countywide vote centers (B), or Perry Preschool (E) — and build a five-column logic model using the Excel steps above. Add a second sheet listing two assumptions and two external factors specific to that case.
- Critique a chain. For your model, identify the single weakest link and explain, in a paragraph, why the program’s overall plausibility is capped by it. (For MTO, consider whether the weakest link is the take-up output or the neighborhood-to-earnings outcome.)
- Indicators (Excel). Add a sixth column to your model. For each outcome and impact box, write one concrete indicator and the data source you would use to measure it. Flag any box for which no data currently exist.
- From boxes to questions. Translate three links in your model into three evaluation questions, and label each as process, outcome, or impact (drawing on Chapter 1).
- County panel application (Excel). A county adopts countywide vote centers (Case B) in 2016. Open the Texas County Panel and use a PivotTable (Insert → PivotTable) to summarize turnout before and after 2016 for that county. Then explain which boxes of the vote-center logic model the turnout variable could serve as an indicator for — and which it cannot.
- Evaluability assessment. For one running case, work through the four evaluability questions: Is the theory coherent? Is the program implemented as designed? Are the intended outcomes defined and measurable? Will an intended user act on the results? Give each a yes/no/uncertain verdict with one sentence of justification, and conclude with a recommendation — proceed to a full evaluation now, or fix X first. State which single weakness, if any, would most cheaply move a “no” to a “yes.”
Transition to Chapter 3
A logic model tells you what to ask and what to measure, but it does not, by itself, tell you whether the program caused the changes you observe. MTO’s earnings claim hinges on a comparison: what would these children have earned without the voucher? The lottery built that comparison in; most programs do not. Chapter 3 makes that question precise. We introduce the counterfactual and the potential-outcomes framework, define a treatment effect formally, confront selection bias, distinguish internal from external validity, catalog the classic threats to a study’s credibility, and lay out the menu of designs — from descriptive to experimental — and the conditions under which each can support a believable causal claim.